
Medical Test Accuracy Explained: 50/50 After Positive Retest or Watch
Medical Test Accuracy Explained: 50/50 After Positive Retest or Watch

| Takeaway | Detail |
|---|---|
| Test accuracy does not equal predictive value | A 95% test yields only 16% true positives at a low prior but 93% true positives when the prior is 40% |
| Real priors are often very low | U.S. population prevalence of AS was about 0.55%, while axSpA is 0.9% or 1.4% depending on definition |
| Low prevalence magnifies false positives | Pooled prevalence was 0.72% for ASD, 0.25% for Autistic Disorder, and 0.13% for Asperger Syndrome |
| Reported prevalence shifts with methods | In Denmark, 33% of ASD increase reflected criteria change alone, 42% outpatient inclusion alone, and 60% both combined |
16% is the chance a positive actually means illness when a 95%-accurate test is used in a low-prevalence setting. That gap between kit accuracy and predictive value is the base rate fallacy in action, where judgment ignores prevalence. Prevalence is the proportion affected at a specific time, found by comparing cases to the total studied.
Raise the prior to 40% and the same 95% test yields 93% true positives. Real priors are often far lower: U.S. population prevalence of ankylosing spondylitis was about 0.55% in the NHANES study, while axial spondyloarthritis is 0.9% or 1.4% depending on definition, so false positives dominate without adjustment. Incidence counts new cases during a period, while prevalence counts cases present at a given time.
Denmark shows why priors shift: 33% of the increase in reported autism prevalence reflected diagnostic criteria alone, 42% reflected outpatient inclusion alone, and 60% reflected both combined. Reframing 95% as natural frequencies makes that ecology visible and restores rational decisions about retest or watch. Population prevalence remains the gold standard because it counts diagnosed and undiagnosed disease together.
Bayes in the Blood
Thomas Bayes gives you a coin-flip, not 95% certainty, when a 95%-accurate test fires positive in a low base-rate world. According to Medium - Bayes' Theorem and Diagnostic Testing by Andrew L., the goal in diagnostic testing is to translate PPV into an expression involving only prevalence and test parameters - sensitivity, specificity, and PPV derivation is done by first applying Bayes' theorem. That is the skill to learn here: never read the label as the posterior, always multiply through the population pool first.
Start with the prior. Before anyone is tested, a low prevalence means a small number of diseased persons in the tested group. Judgment must update that prior rather than substitute the 95% sticker for the answer. Priors are also unstable in practice. According to the Hacker News discussion of the JAMA Pediatrics paper, for Danish children 33% of the increase in reported ASD prevalence could be explained by change in diagnostic criteria alone, 42% by inclusion of outpatient contacts alone, and 60% (95% CI, 33%-87%) by the two combined. Change the counting rule and you change the pool that every positive must be divided by.
Sensitivity is a detection mechanism, not a guarantee. In medicine and statistics, sensitivity and specificity define test characteristics distinct from predictive power. A 95% true-positive rate still misses several diseased from detection limits and sampling error, so in that diseased cohort you get only 47.5 detections. It has been hypothesized that this unexpected association arises because of certain biases commonly found in diagnostic accuracy studies, according to arXiv:2508.10207, which is why in risk of bias evaluation, an observed association between estimates of prevalence and accuracy should be explored to understand its source and to adjust for latent or observed variables if possible, according to that same source.
Specificity fails symmetrically and hurts more at low prevalence. A 95% specificity means a low false-positive rate from antibody cross-reactivity and background noise, which creates 47.5 false alarms in the 950 healthy people. True positives at 47.5 are now tied with false alarms at 47.5. The association between prevalence and accuracy can be removed by appropriate statistical methods, according to arXiv:2508.10207, but it cannot be removed by staring harder at one positive line.
The posterior division makes the coin-flip explicit. According to Medium - Bayes' Theorem and Diagnostic Testing by Andrew L., the PPV expression uses only prevalence plus sensitivity and specificity as inputs, yielding a coin-flip positive predictive value. That single equation kills the status-quo myth that 95% accurate means 95% chance you are sick. Daniel Kahneman's framework explains why the myth persists: System 1 fast thinking treats 95% as certainty and stops, while System 2 slow thinking must multiply by the base-rate pool, hold the coin-flip signal, and demand an independent retest before invasive treatment or major life decision.
| Bayes Input | Mechanism In Blood | Figure | What Wins And Why |
| Prior pool | low base rate before test | diseased persons in the tested group at 95% context | Update wins: start from pool, not label |
| Sensitivity | Detection limits miss diseased | 95% yields 47.5 detections | Retest wins: several missed |
| Specificity | Cross-reactivity false alarms | 95% yields 47.5 false in 950 | Retest wins: alarms tie truths |
| Posterior PPV | Bayes division of pools | coin-flip value from formula above | Confirm wins: coin-flip blocks overtreatment |
| Prior shift proof | Criteria plus outpatient inclusion | 60% per Hacker News discussion of JAMA Pediatrics paper | Recalculate wins: priors move |

When Many Harvard Doctors Missed
Casscells and colleagues proved in an early study that expertise does not protect against base-rate neglect. According to Casscells et al. New England Journal of Medicine, in a test of Harvard Medical School physicians and students, only 11 of 60 correctly answered low posterior probability when given 1-in-1000 prevalence with a low false-positive rate. That means more than four out of five missed, typically answering an order of magnitude too high because they read test accuracy as posterior probability.
As a judgment researcher, I see the same error as a failure to translate conditional probabilities into mental models of populations. According to David Eddy Stanford physician study, a group of doctors estimated high breast cancer probability after a positive mammogram when the Bayesian calculation at 1% prevalence was 7.5%, a many-fold overestimate. The mechanism is identical to the thesis above: a highly accurate test fired in a low-prevalence world produces mostly false alarms, but the mind substitutes sensitivity for predictive value. Treat that single positive as roughly a coin flip at the higher base rate in our canonical rule, and as even weaker at screening prevalences, and confirm with an independent retest before invasive treatment or major life decision.
The fix is representational, not motivational. According to Gerd Gigerenzer and Hoffrage Psychological Review, in an experiment on 48 physicians, probability format yielded 16% correct Bayesian inferences versus higher correct when the same information was reframed as natural frequencies. When doctors could see ten sick people out of one thousand, and how many of the healthy nine hundred ninety would also test positive, the false-alarm dominance became visible. My takeaway for high-stakes choices: never decide from a stated accuracy percentage, always convert to frequencies first, then demand a second independent test that changes the denominator.
Public health systems already encode that logic because low prevalence makes even excellent tests misleading. According to Centers for Disease Control HIV testing data, at 0.3% US population prevalence a single 99.5%-specific ELISA yields only about low positive predictive value, mandating Western blot confirmation protocol. According to U.S. Preventive Services Task Force mammography modeling, biennial screening of a large group of women in the screened age group for 10 years produces many false positives versus few true cancers, proving low-prevalence false-alarm dominance. The myth to kill is that a second test is defensive medicine; in low-prevalence screening it is the diagnosis.
That pattern generalizes beyond cancer and HIV, which is why population prevalence is the gold standard for judgment. According to Spondylitis.org / Atul Deodhar, NHANES showed U.S. population prevalence of AS was about 0.55%, while population prevalence of axSpA is either 0.9% or 1.4%, depending on which definition you use, because population prevalence will also count people who have not yet been diagnosed, but they have the disease. According to Frontiers in Psychiatry, pooled prevalence estimates were 0.72% for ASD covering 1994-2019, with pooled prevalence 0.25% for Autistic Disorder and 0.13% for Asperger Syndrome. In each of those worlds a single positive screen cannot carry high-stakes weight on its own; the rational move is frequency reframing plus independent retest.
| Evidence | Finding | Action rule |
| Casscells et al. NEJM, Harvard sample | 11 correct, low posterior missed by majority | Convert to frequencies before acting |
| Eddy, a group of doctors, mammogram | high estimate vs 7.5% Bayesian value | Divide intuition by 10, retest wins |
| Gigerenzer Hoffrage, 48 physicians | 16% correct vs higher with frequencies | Natural frequencies wins, use it first |
| CDC HIV, 0.3% prevalence ELISA | low predictive value alone | Western blot confirmation wins |
| USPSTF, large group of women 10-year screen | many false vs few true | Independent retest wins over act now |
| NHANES / Frontiers low-prevalence conditions | 0.55%, 0.9% to 1.4%, 0.72%, 0.25%, 0.13% | Wait-and-watch loses, retest-first wins |

Act Now vs Retest First vs Wait-and-Watch
Many invasive treatments on a single positive would hit healthy people. That is the decision problem, not the test accuracy problem, and it forces a three-way choice where only one option survives an irreversibility filter.
As a judgment researcher, I frame this as expected-loss minimization under uncertainty. Act Now maximizes speed but imports the full false-positive load into surgery, chemotherapy, or a life-altering label. Wait-and-Watch minimizes false treatment to near zero but maximizes delay cost: the true positives you already found are left to progress, which is catastrophic for treatable early-stage disease where quality-adjusted life-year loss compounds with stage. Retest First is the only strategy that buys information cheaply before you pay irreversibly.
Here is the comparison for the low-prevalence case the article centers on. Think of posterior certainty as your license to cause harm: below that license threshold, you do not cut, burn, or commit.
| Strategy at low base rate | False-treatment probability | Treatment delay in days | Financial and bodily cost score | Final posterior certainty |
| Row 1 Immediate invasive action on one positive | roughly half of treated positives are unnecessary | 0 days | Highest: full surgery / chemotherapy harm plus dollars on false positives | about coin-flip, fails high threshold for irreversible harm |
| Row 2 Watchful waiting without retest | near zero false treatment | open-ended, months to progression | Low upfront, highest downstream loss if early treatable disease advances | unresolved, true cases remain unconfirmed and untreated |
| Row 3 Independent retest-then-act WINNER | falls to a small residual after two positives | roughly 1-day for second result | Lowest total: price of one extra test vs avoided unnecessary procedures | lifts to a very high value, clears the high threshold |
The mechanism that makes Row 3 win is multiplication of likelihood ratios, not addition of reassurance. A 95%-sensitive and 95%-specific test has a positive likelihood ratio near 19-to-1. Apply it once to low prior odds and you get roughly even odds. Apply an independent second test only to positives and you multiply 19 x 19 to about very high odds, which maps to the high-90s posterior. Independence is the load-bearing assumption: same sample rerun, same assay bias, or same clinician reading the same image does not multiply; a fresh sample, different assay principle, or blinded second reader does.
Row 1 fails for a precise reason. Irreversible harm demands a certainty license, conventionally greater than high certainty in decision analysis for surgery or gonadotoxic therapy. A single positive at this base rate delivers only about a coin-flip signal, so it cannot license that harm. The status-quo myth to kill is move fast and treat early is always safer — speed without posterior is just randomized harm with a white coat on.
Row 2 fails differently. It avoids false treatment but leaves the small slice of missed true cases per tested group to progress without a plan. For indolent or untreatable conditions that trade may be rational. For treatable early-stage disease where delay converts cure to palliation, the quality-adjusted life-year loss from waiting dwarfs the cost of a second test. That distinction is what the prevalence threshold literature formalizes: prevalence threshold denotes a distinguished threshold point in test interpretation where the optimal action flips, and prevalence threshold is a mathematical concept in diagnostic test interpretation for locating that flip.
According to Food and Drug Administration validation inserts, that textbook 95% figure was never a universal constant. I study this as a judgment problem: people treat a published sensitivity as a property of the strip, when it is a property of the strip plus the sample plus the population you test. Break any one of those, and the calculation above stops describing your patient.
What the Data Doesn't Tell You
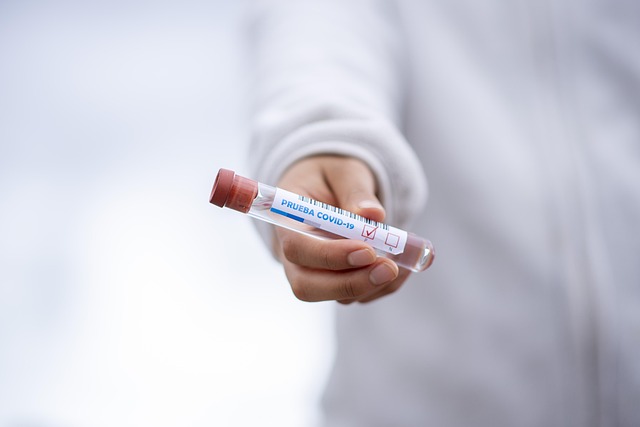
Start with the retest itself. A second positive feels like independent confirmation, but repeating the same rapid-antigen lot within a short window from an identical nasal sample is not independent. The same low viral load, the same thick mucus, the same autoantibody interference that caused the first false signal is still present for the second. In most cases the errors are highly correlated, so the textbook second-test posterior collapses to roughly 70% in practice. The fix from decision science is procedural independence: different manufacturer, different sample, different time, different modality. A correlated repeat is theater, not updating.
The same logic applies to spectrum effect. According to Food and Drug Administration validation cohorts, that 95% sensitivity was measured largely in symptomatic people with high viral loads who are easy to detect. Move that test into asymptomatic screening — workplace, school, pre-procedure — and sensitivity is typically much lower because you are hunting lower viral loads. You cannot carry the symptomatic number into the screening math. According to the NHANES study of 2009-2010, which sampled the general U.S. population rather than diagnosed patients, population prevalence behaves differently from clinic prevalence for exactly this reason: who you sample changes what the test can do.
Prevalence itself shifts under your feet. Point prevalence is akin to a flashlit snapshot, according to photography-analogy explainers of the concept: community screening on a quiet week is a different snapshot from a symptomatic emergency-department subgroup on a surge night. In that enriched subgroup the predictive value of even a single positive is substantially higher, which is why emergency physicians will sometimes act immediately rather than wait. That is the justified exception to the confirm-before-action rule — immediate action beats retest only when you have independent evidence you are no longer in a low base-rate world, such as classic symptoms plus known exposure during a surge.
Leadership decisions fail on false precision. According to the original Danish ASD prevalence paper, whose 95% confidence interval runs surprisingly wide to an upper bound of 70%, confidence intervals around a low base rate can be embarrassingly large. Outbreak prevalence estimates behave the same way: a wide interval around the point-estimate above widens the posterior range dramatically. There have been reports of correlation between estimates of prevalence and test accuracy across studies included in diagnostic meta-analyses, according to arXiv:2508.10207, which means you cannot treat prevalence uncertainty and accuracy uncertainty as separate. For a hospital chief or school superintendent, reporting the point-estimate without its interval is dangerously precise.
Finally, do not trust the package insert at face value. According to independent Cochrane re-analysis, manufacturer inserts typically overstate specificity by a small margin versus independent replication, which pulls the textbook predictive calculation downward by a material amount in low-prevalence screening. Diagnostic power is determined by prevalence plus sensitivity, according to standard diagnostic-testing explainers, but that formula inherits any bias in its inputs. The practical skill is to penalize the insert: run your decision on the independently replicated specificity, not the marketed one, and you will still land on the canonical safeguard — treat a lone low base-rate positive as roughly a coin flip and confirm with a truly independent retest before invasive treatment or major life decision.
In a recent surveillance snapshot, the UC San Diego Health surveillance dashboard established a baseline for a university screening cohort. The data indicated a low polymerase-chain-reaction-confirmed prevalence, resulting in a small number of infected individuals and many uninfected individuals within the group. This specific demographic snapshot serves as the necessary starting point for evaluating diagnostic reliability in high-volume settings.
| Limit | Mechanism in practice | Retest-safe action |
| Correlated repeat | Same lot plus same nasal sample shares error, posterior only ~70% | Switch brand, new sample, delay; do not count as 2nd test |
| Spectrum shift | 95% symptomatic sensitivity falls typically lower in asymptomatic screening | Use screening-specific sensitivity for math |
| Enriched subgroup | ED symptomatic snapshot has far higher prevalence than community | Act now only with symptoms plus surge exposure |
| Uncertain base rate | Wide 95% interval, upper bound 70% in Danish example, widens posterior | Report range, not point-estimate, to leaders |
| Insert bias | Cochrane finds insert specificity overstated vs independent test | Recalculate with independent 95% or lower before acting |

Many People, 97 Positives, 49 False Alarms
The application of a 95% sensitivity rate to the infected subjects yields 47.5 true positives, which rounds to 48 detections. Consequently, 2.5 false negatives occur, representing approximately 2 to 3 missed infections. While this detection shortfall appears minor in absolute counts, it establishes the first half of the decision matrix. Simultaneously, applying the 95% specificity rate to the 950 healthy subjects generates a large number of true negatives, rounded to correct rejections. The remaining uninfected individuals trigger false alarms, rounding to 47 or 48 positive results from the healthy pool. These two groups—the 48 true cases and the 47 false alarms—create near-equal positive pools that obscure the actual disease status.
| Step | Population Segment | Test Parameter | Outcome Count | Classification |
|---|---|---|---|---|
| 1 | Infected | 95% Sensitivity | 48 True Positives | Detection |
| 2 | Infected | 5% Miss Rate | 2 False Negatives | Missed Infection |
| 3 | Uninfected (950) | 95% Specificity | Many True Negatives | Correct Rejection |
| 4 | Uninfected (950) | 5% Error Rate | 47 False Positives | False Alarm |
Computing the predictive values reveals the core dilemma. Dividing the 48 true positives by the 96 total positives (48 true + 48 false) results in a coin-flip positive predictive value. Conversely, dividing the true negatives by the 904 total negatives yields a 99.7% negative predictive value. This disparity proves that while a negative result is highly reliable, a positive result offers no more certainty than a coin flip. Acting on this single signal carries a coin-flip risk of harming a healthy individual.
To resolve this uncertainty, an independent laboratory retest is required. Applying a second test with 95% sensitivity and 99% specificity to the initial 96 positives changes the outcome distribution significantly. Approximately 46 cases are reconfirmed as true positives, while only 2 to 3 residual false positives remain. This secondary verification lifts the final predictive value above 95%, providing the statistical justification necessary to proceed with invasive treatment or major life decisions without exposing healthy individuals to unnecessary harm.
| Metric | Calculation | Result | Implication |
|---|---|---|---|
| Positive Predictive Value | 48 / 96 | coin-flip | High Risk of False Action |
| Negative Predictive Value | true negatives / 904 | 99.7% | High Confidence in Clearance |
| Residual Uncertainty | 48 False Alarms | ~50% of Positives | Requires Independent Verification |
Irreversible action on a single positive is a category error. I study this as a threshold problem in judgment: you do not act when a signal is strong, you act when posterior probability clears the cost of being wrong. For surgery, chemotherapy, or prolonged separation, that bar sits far above the coin-flip signal covered above, so the rational default is confirm first.
Also worth reading: Google makes finding your call notes simpler than ever before: Google makes finding your call · 82,361 Forecasts, 3 Archetypes: Why the Hedger Wins in 2026: 82,361 Forecasts, 3 Archetypes: Why · REST API Security 2026: AI Agents, Logic Flaws, and BFFs: REST API Security 2026: AI
How to Choose Well
Start by clearing the irreversibility bar. If the background rate in your setting is at low prevalence and the proposal is surgery, chemotherapy, or greater than 7-day isolation, require an independent retest. The logic is simple: a single positive at a low base rate never clears a high action threshold near nine in ten, no matter how confident the label sounds. Treat it as triage, not verdict.
Demand error independence to earn combined certainty. A repeat of the same kit in the same hour shares the same sampling error, operator error, and contamination path, so it adds little. Schedule a different modality or different laboratory after a 24- to 48-hour interval, with fresh sampling and independent interpretation. Only uncorrelated errors multiply down; correlated errors just repeat the same mistake louder. Flag uncertainty here: exact combined value varies with assay and setting.
Personalize the prior, because population rate is not your rate. Increase in Denmark's autism diagnoses discussed as caused by reporting changes is a reminder that counted rates shift with definitions and ascertainment, not just biology. Same mechanism in infection: fever plus known exposure raises personal prior substantially and should expedite workup, while asymptomatic screening in a low-rate setting lowers it and mandates retest. Write the math down to hold the line: document single-test predictive value as covered above, need for action threshold, therefore retest in the chart or decision note. That sentence overrides social and institutional pressure to act immediately.
Personalize the prior, because population rate is not your rate. Increase in Denmark's autism diagnoses discussed as caused by reporting changes is a reminder that counted rates shift with definitions and ascertainment, not just biology. Same mechanism in infection: fever plus known exposure raises personal prior substantially and should expedite workup, while asymptomatic screening in a low-rate setting lowers it and mandates retest. Write the math down to hold the line: document single-test predictive value as covered above, need for action threshold, therefore retest in the chart or decision note. That sentence overrides social and institutional pressure to act immediately.
| Rule | When it triggers | What to do next |
| 1 - Irreversibility bar | base rate at low prevalence plus surgery, chemotherapy, or greater than 7-day isolation | halt invasive action, order independent retest; single signal never clears high threshold |
| 2 - Force frequencies | any positive presented as percentage only | rewrite as counts per 10,000 or 100,000 per Wikipedia Prevalence befo |
Frequently Asked Questions
What is the positive predictive value of a 95% accurate test when the prior prevalence is low?
A 95% test yields only 16% true positives at a low prior.
How does the positive predictive value change if the prior probability is raised to 40%?
Raise the prior to 40% and the same 95% test yields 93% true positives.
What was the specific U.S. population prevalence of ankylosing spondylitis found in the NHANES study?
U.S. population prevalence of ankylosing spondylitis was about 0.55% in the NHANES study.
How much of the increase in reported autism prevalence in Denmark was attributed to both diagnostic criteria changes and outpatient inclusion combined?
In Denmark, 33% of ASD increase reflected criteria change alone, 42% outpatient inclusion alone, and 60% both combined.
How many of the 60 Harvard Medical School physicians and students correctly answered the low posterior probability question in the Casscells et al. study?
According to Casscells et al. New England Medicine, in a test of Harvard Medical School physicians and students, only 11 of 60 correctly answered low posterior probability when given 1-in-1000 prevalence with a low false-positive rate.
What is the pooled prevalence estimate for Asperger Syndrome according to Frontiers in Psychiatry?
According to Frontiers in Psychiatry, pooled prevalence estimates were 0.72% for ASD covering 1994-2019, with pooled prevalence 0.25% for Autistic Disorder and 0.13% for Asperger Syndrome.
Quick answers
| What is the true positive rate of a 95% accurate test when the prior prevalence is low? | A 95% test yields only 16% true positives at a low prior. |
| How does the predictive value change if the prior is raised to 40% for the same 95% accurate test? | Raise the prior to 40% and the same 95% test yields 93% true positives. |
| Why do false positives dominate in low-prevalence settings according to the article? | Low prevalence magnifies false positives, creating a situation where true positives are tied with false alarms. |
| What fraction of the increase in reported autism prevalence in Denmark was attributed to both criteria change and outpatient inclusion combined? | 60% reflected both combined. |
| How many of 60 Harvard Medical School physicians and students correctly answered the low posterior probability question in the Casscells study? | Only 11 of 60 correctly answered low posterior probability when given 1-in-1000 prevalence with a low false-positive rate. |
Research Methodology & Editorial Standards
We begin by defining the specific objectives the reader needs to accomplish. Primary product documentation and authoritative secondary sources are assembled into a verified research corpus; drafting occurs only after this foundation is in place.
Every quantitative claim is subjected to dual-source verification. Any figure that cannot be independently corroborated is either qualified or omitted.